Neuronal image registration
Motivation
Think about characterizing a crystal. XRD shows the crystal structure. SEM gives the sample morphology and element combination and ARPES reveals the band structure. All these measurement can link together naturally and provides different pieces of information about the crystal. If one crystal piece breaks during the measurement, it’s fine, just change another one, which should have similar (if not exactly the same) properties.
However, in neuroscience, things are a little bit messier. The modern two photon imaging can record 3D movies of mice’s neuron firing during the cognitive tasks while you don’t internal information of the neurons. The in-situ sequencing of the brain slices can identify the neurons’ type but first of all you will need to slice the brain. Definitely it is worthwhile to perform two photon imaging when the mouse is alive and then do the in-situ sequencing for the after life. Now the problem is that how one can locate the exact same neuron in the two photon imaging data and in the ex-vivo slices so that every piece of information can be linked.
A typical two photon imaging data of neurons.
This registration problem is not easy. The neurons in the 3D data looks like each other with the experimental resolution. As a result, it is not likely we can match two neuron images like what people did to match two faces. Another intuition is to do cross-correlation to match the ex-vivo photo with each slice of the 3D data. Theoretically this can be done. However, the 3D data can be rotated so the degrees of freedom is actually 6 (x-y-z for translation and alpha-beta-gamma for rotation). Cross-correlation can only take care of three degrees of freedom. Assuming there are 50 steps in each dimension then you need to rotate your 3D data cube for (50)^3 times. Even if you downsample your 3D data to 100-by-100-by-100 pixels and can rotate it within 10 seconds each time, it still needs 1,250,000 seconds to finish all the rotating.
Method and result
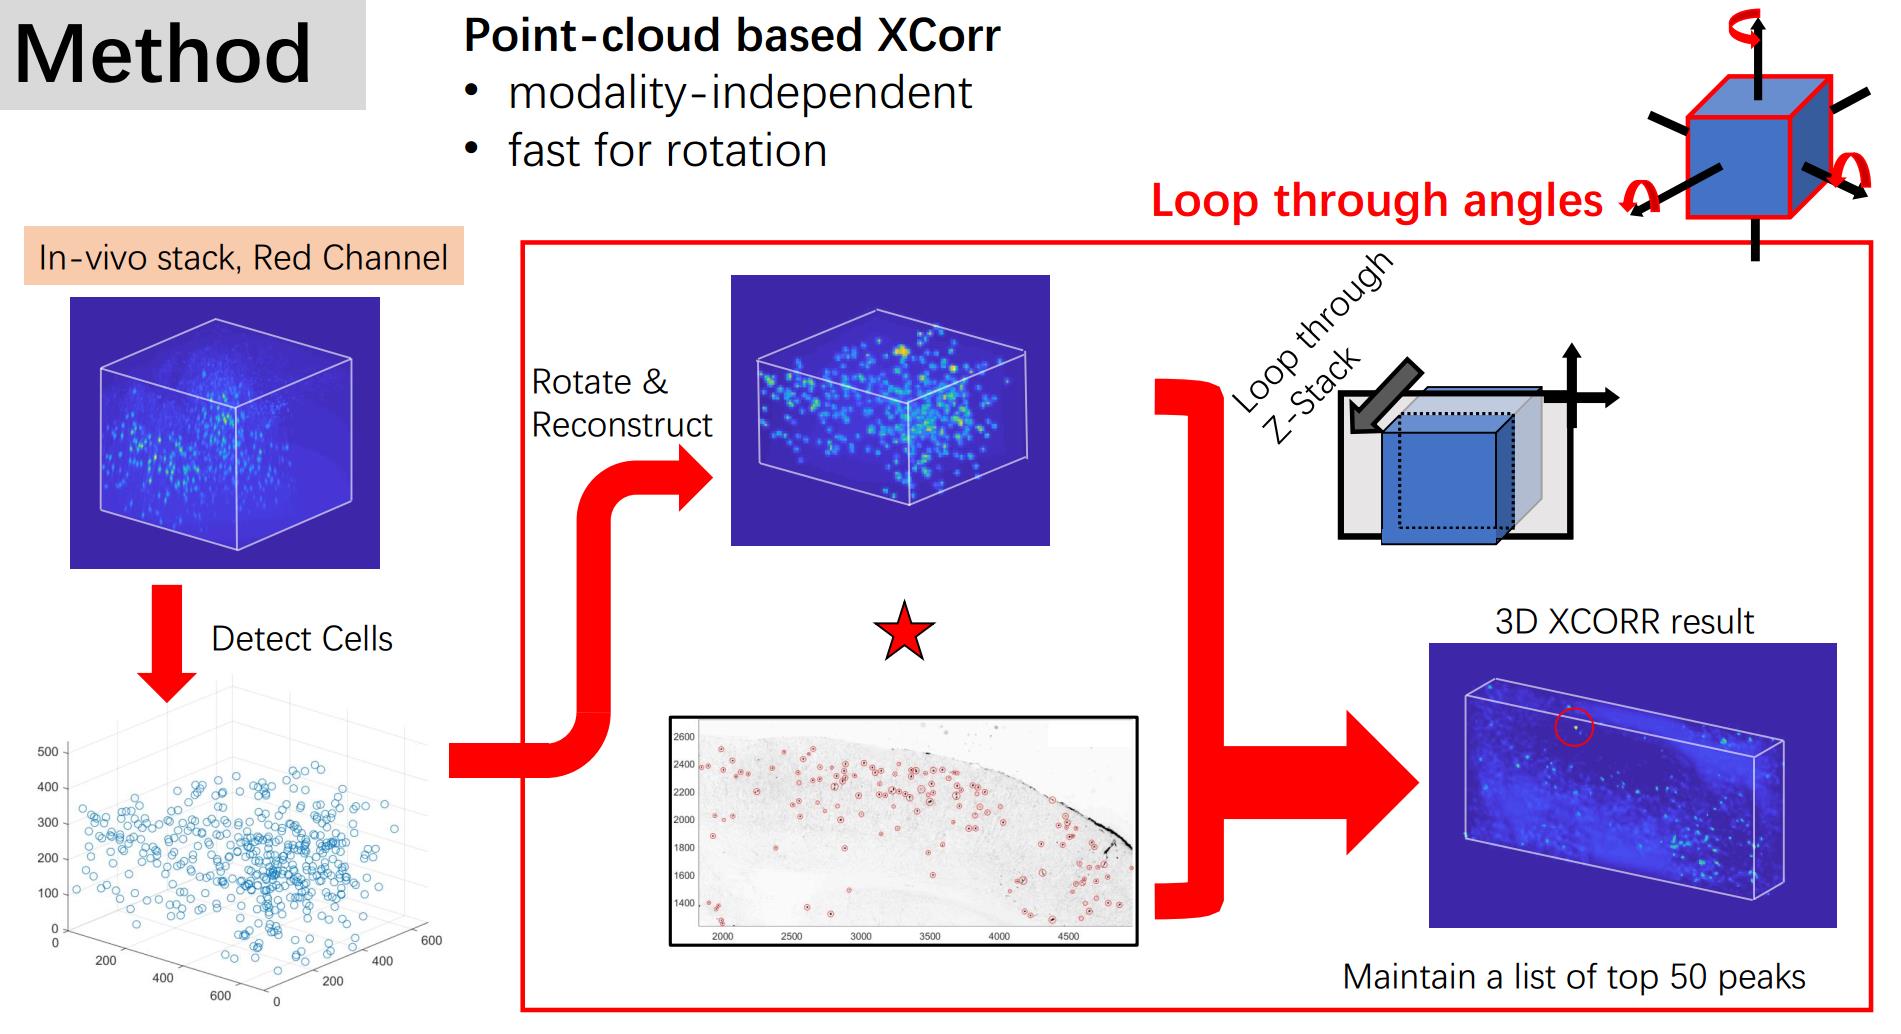
Well, how to do it? Think about the features of the data. The most robust feature one might use is the shape of the constellation that the neurons form. Even in the cross-correlation map, the information covered is actually the position of the neurons. So, to simplify the computation process, we can detect all the positions in the 3D stack and rotate the coordinates. Then we can ‘reconstruct’ the 3D data sets by simply use a Gaussian kernel to represent the existence of the neurons without losing much useful information. Then we can do cross-correlation between the slice and the reconstructed 3D data.
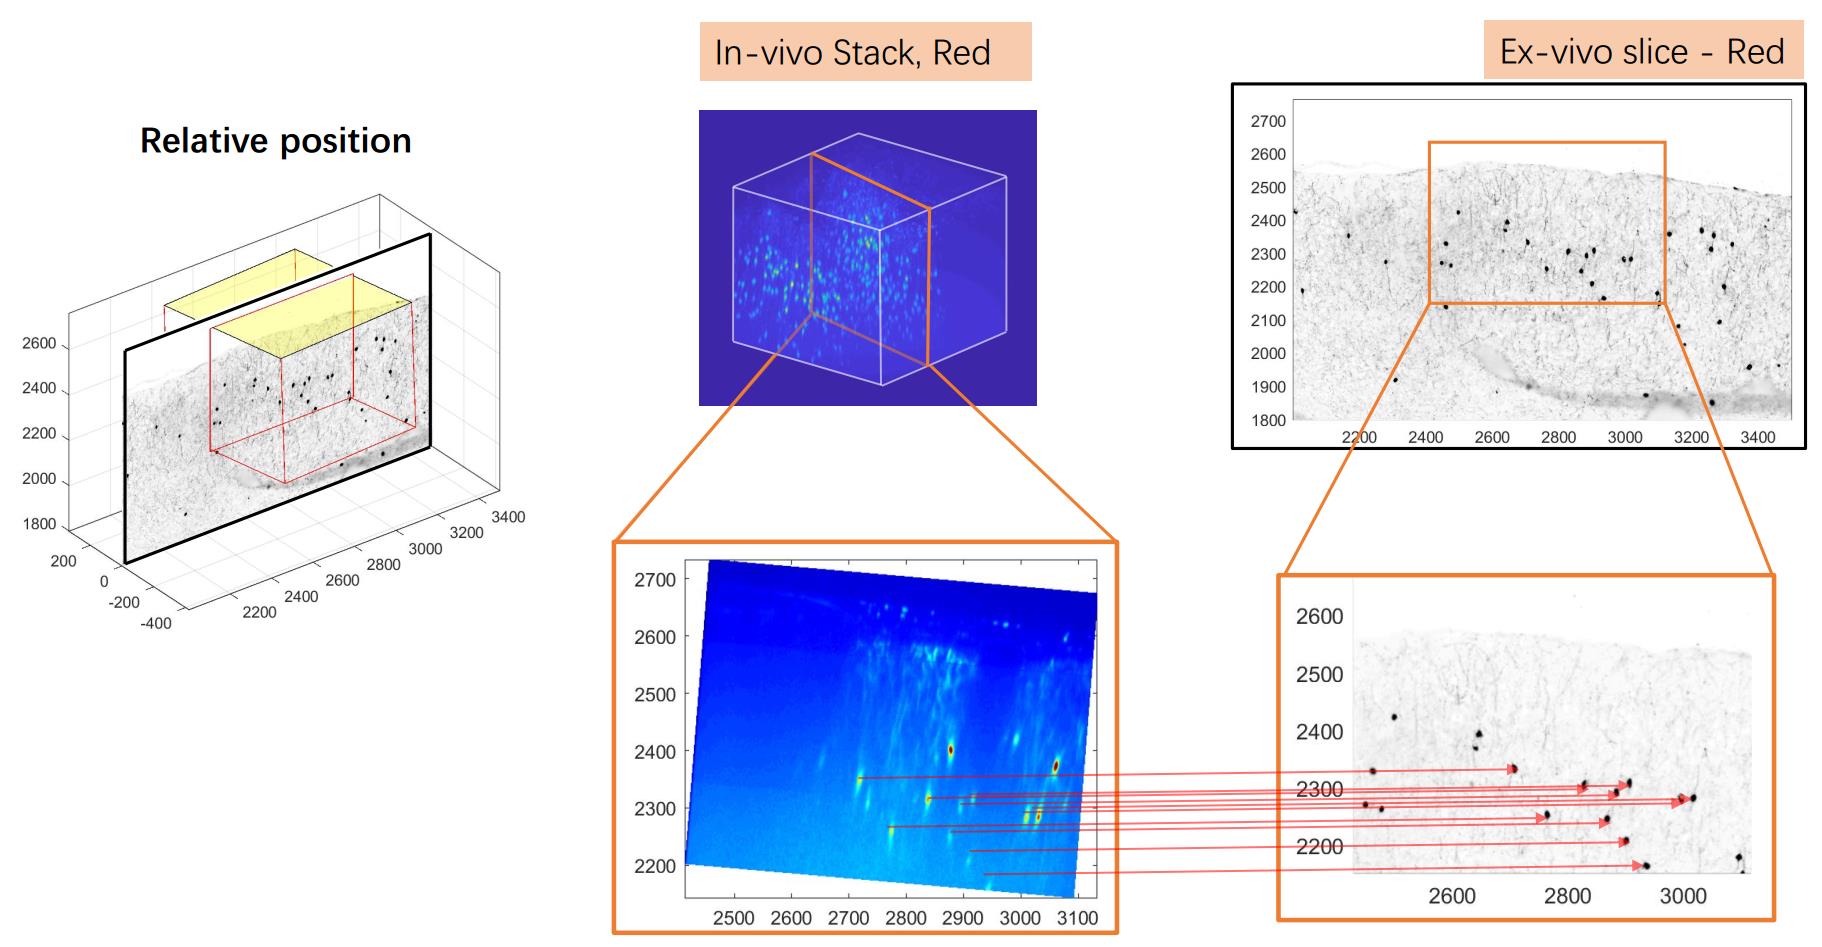
We tested this method in a generated fake data set and then applied it to a real data set. The result is shown in the figure at the top of the page.
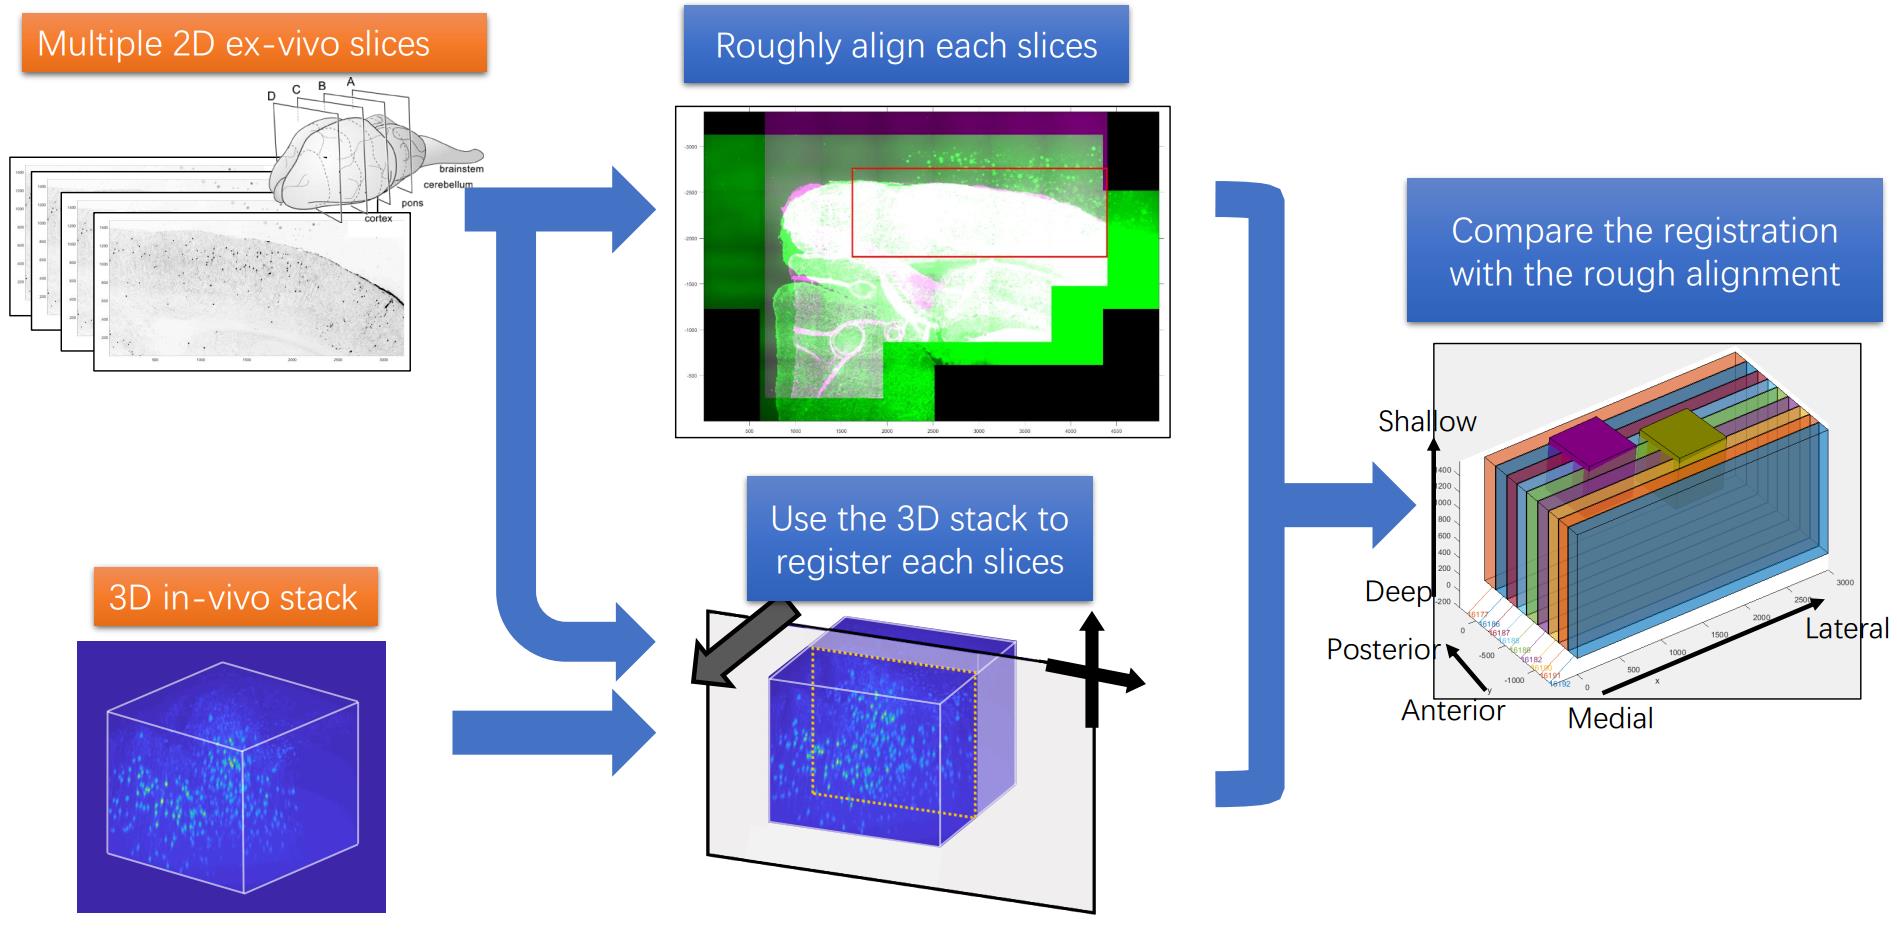
For multiple slices, there are more information we can use for the registration task. A pipe line can be concluded as the following figure:
The code is put in the github repository. https://github.com/ha-ha-ha-han/NeuromicsCellDetection/